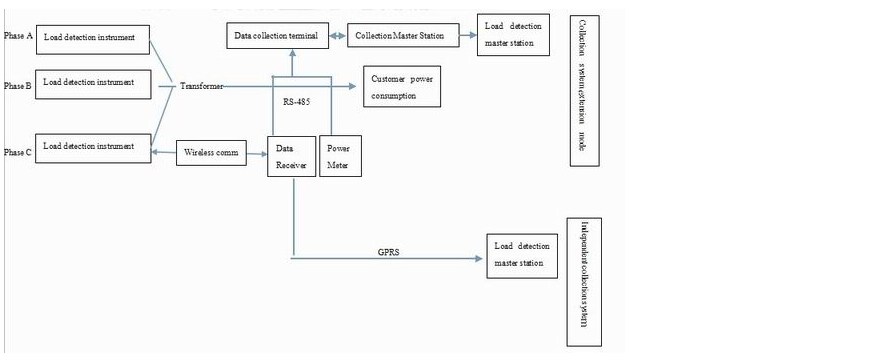
Framework of Power Theft Detector Model
Introduction
I consider myself an incurable continuous learner. You won’t agree with me less when I say the capacity and ability to learn, re-learn and unlearn is a crucial skill in this current era of information explosion. Little wonder when Edvancer Venture and University of Petroleum and Energy Studies combined to create the Post Graduate Professional Certificate in Data science; I seized the opportunity and enrolled as soon as possible.
The course is group into the following broad areas:
-
Fundamental knowledge about Data Science, Data Analytics, Machine Learning and their importance to businesses and organizations
-
Introduction to the primary programming language of Data Science and Machine Learning: R & Python
-
Hands-on and practical session on data handling cleaning and Model building
-
Student Capstone Project wherein students apply all they have learned to solve data-related problems in the following sectors:
- Aviation
- Banking & Finance
- E-Commerce
- Logistics & Supply Chain
- Energy
My favourite aspect of the program is the Capstone Project session because it provides an opportunity to practice on real-life datasets. I chose the Capstone on Energy as the problem of Energy theft was particularly dear to my heart. I have withness the problem first hand in my former residence, and I could remember asking why was such impunity not detected and the culprit made to face the consequences of the crime of Energy theft as enshrined in the Law. Thus curiosity and the passion to apply my newly acquired skills to practical use informed my decision to work on Energy Theft Detector Model.
Consequently, today’s post is a chronicle of how I built an Energy theft Detector model. For easy comprehension, we divided the project into the following sub-themes:
- Making Sense of the Data
- Data cleaning and pre-processing
- Correlations and Outliers
- Check Feature Importance
- Simple Base-model
- Building model
Import Necessary Packages and Modules
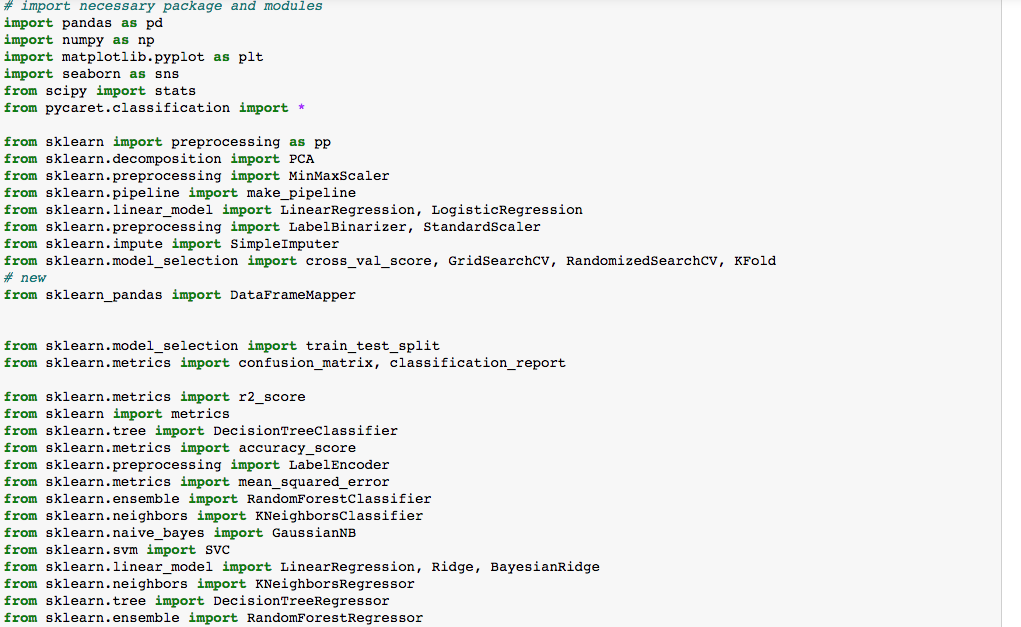
The knowledge of the requisite package to use in a given project or problem depends on the experience of the practitioner and the level of work to be done.
Making Sense of The Data
In any machine learning or data science project, the data is about the most important aspect. The level to which you understand the data is base on domain knowledge of the practitioner. I had to go the extra mile to understand the data and all of its variable. Data research is essentially necessary when the problem is not under your primary domain knowledge. To this end, I read far and wide to get a sense the meaning behind the various variables and ultimately produce a data dictionary:

Data Cleaning and Preprocessing
Load data into the pandas package and display a small portion
elect_data = pd.read('Power_theft.csv')
elect_data.head()

From the above data, our target variable is global_active_power. In other words, global_active_power is our dependent variable, whereas other variables are our independent variables.
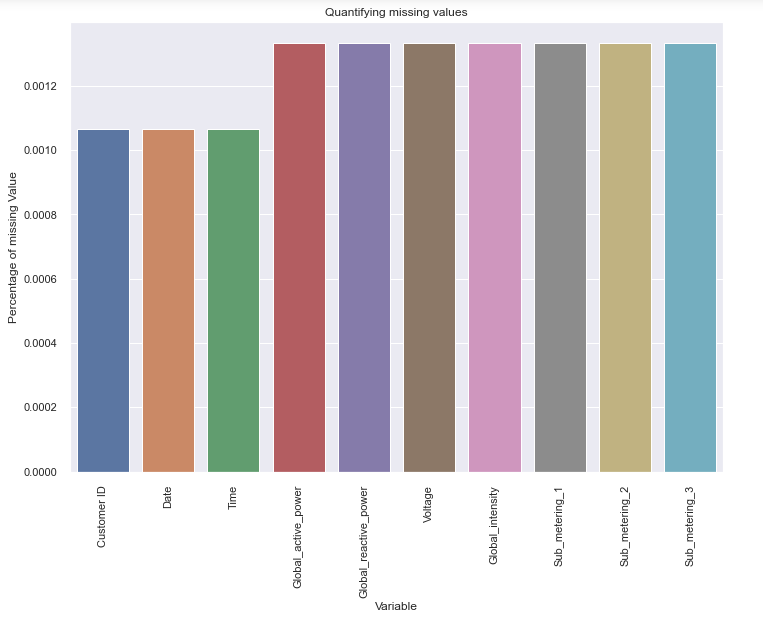
Since our dependent variable data type is float or decimal, our model would invariably be linear regression, a prevalent supervised learning machine learning model. Before any further operations on the data, it is necessary to check for missing values and treat accordingly.

Correlation and Outlier
Before I go further into the procedures and steps taken in the course of building the model, I will like to stress an essential concept I learned about the dependent variable. From my research, I decipher that ‘active power’ is a useful power; thus, the energy that powers our electronics, bulb, heater e.t.c. In an ideal system, the amount of power supplied should equate the amount of power utilized within a given period. Consequently, the simplest means to detect irregular consumption of power would be through outlier detection. Thus Utility customers with an unusual amount of consumption of electricity, especially when compared with the amount of electricity supplied, such usage or consumption may be deem or considered suspicious.
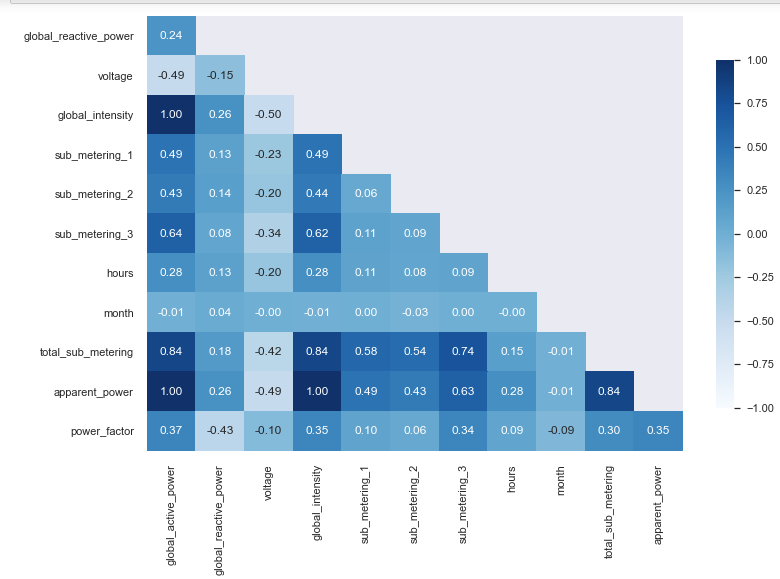
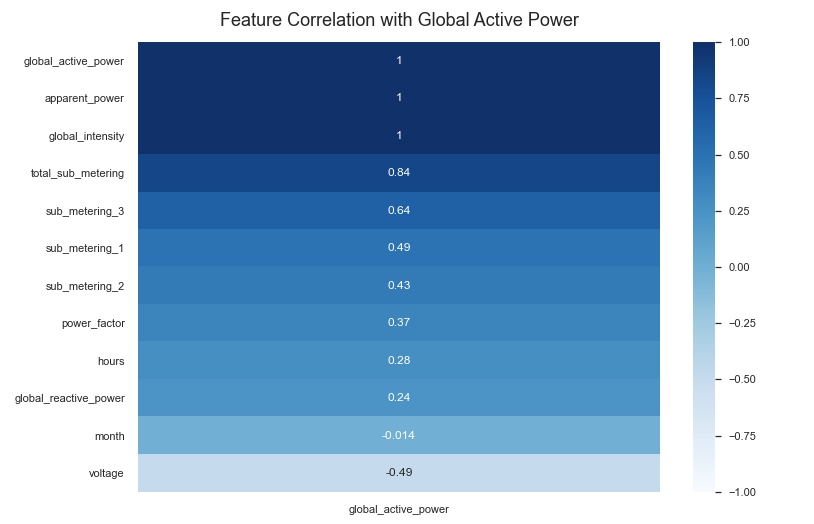
From the above visualization we understand the correlation coefficient of the various variables. However, we stand a better chance of understanding the correlation of other variables, i.e. independent variables with the target variable or independent variable.

We can see very clearly that there are a few irregulars activate power amount via the above box plot.
Check Feature Importance
Knowing the key features of your model would go a long way to improve the overall performance of the model. It would also provide rich information about the features that can make or break our model. Tree-based algorithms like Decision tree, Random Forest e.t.c are suitable for knowing essential features in your models.

Base Model
Having a base model is a critical step to the art and craft of model building. Through a base model, the practitioner can effectively measure and compare model performance and improvement. We can implement a base model with the scikit-learn dummy model function. Personally, I usually, if it is a Linear Regression problem, customize mine as follows:
# Find the mean of the target variable
meansimple = elect_theft_trim['global_active_power'].mean()
print(meansimple)

#We use the numpy repeat function to simulate a predicition
y_base = elect_theft_trim['global_active_power'].values
y_pred = np.repeat(meansimple,len(elect_theft_trim['global_active_power']))

#let also show that R_square is equal to zero.
r2_score(y_base,y_pred)
Build Various Random Model
A popular cliche in machine learning says: All models are wrong, but some are useful. The wisdom behind this axiom stems from the fact that as a practitioner no one model is right for a problem hence one must cultivate the habit of building several models as a veritable means of knowing which may be useful or practical for the situation or data at hand. The approach is to create a different version of the primary dataset base on other functionalities carried out on the dataset. For instance, in the Power theft problem, I made the following versions:
- Original Data: This usually the untampered version of our original datasets
- Standardized Data: Some school of thought opined that regression model performs better when the data is Standardized
- PCA Reduction Data: There may also be the need to reduce the variables of datasets through Principle Component Analysis.
I usually pass these versions through various algorithms via a giant loop to check their respective performance. I call this process, Out-of-the-box-models.
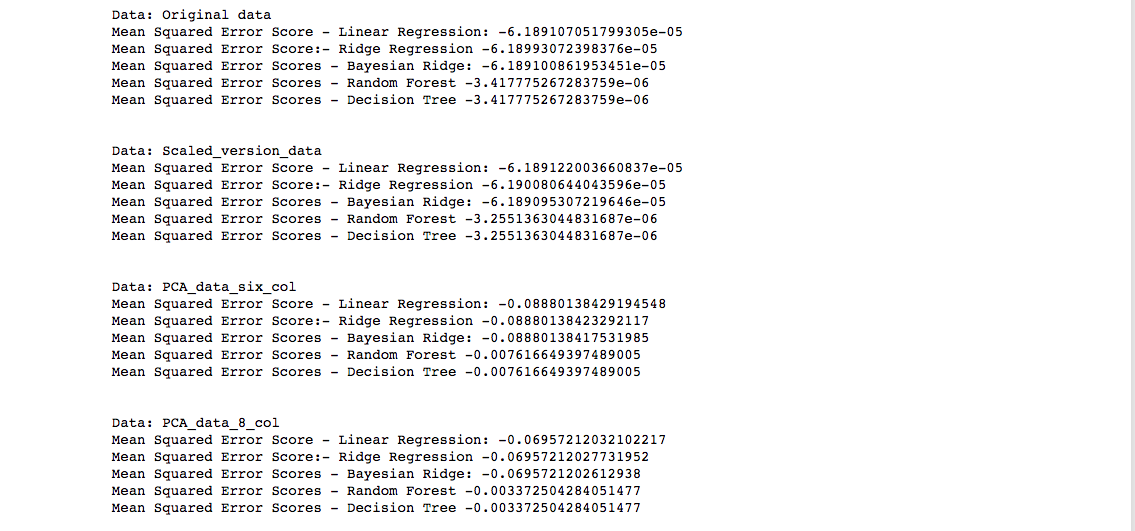
From the above, we can choose the models with the best F1 score for further tuning and improvement. The above steps are the way and manner I approach model Building and machine learning task. I hope you have learned something today. Bye!